

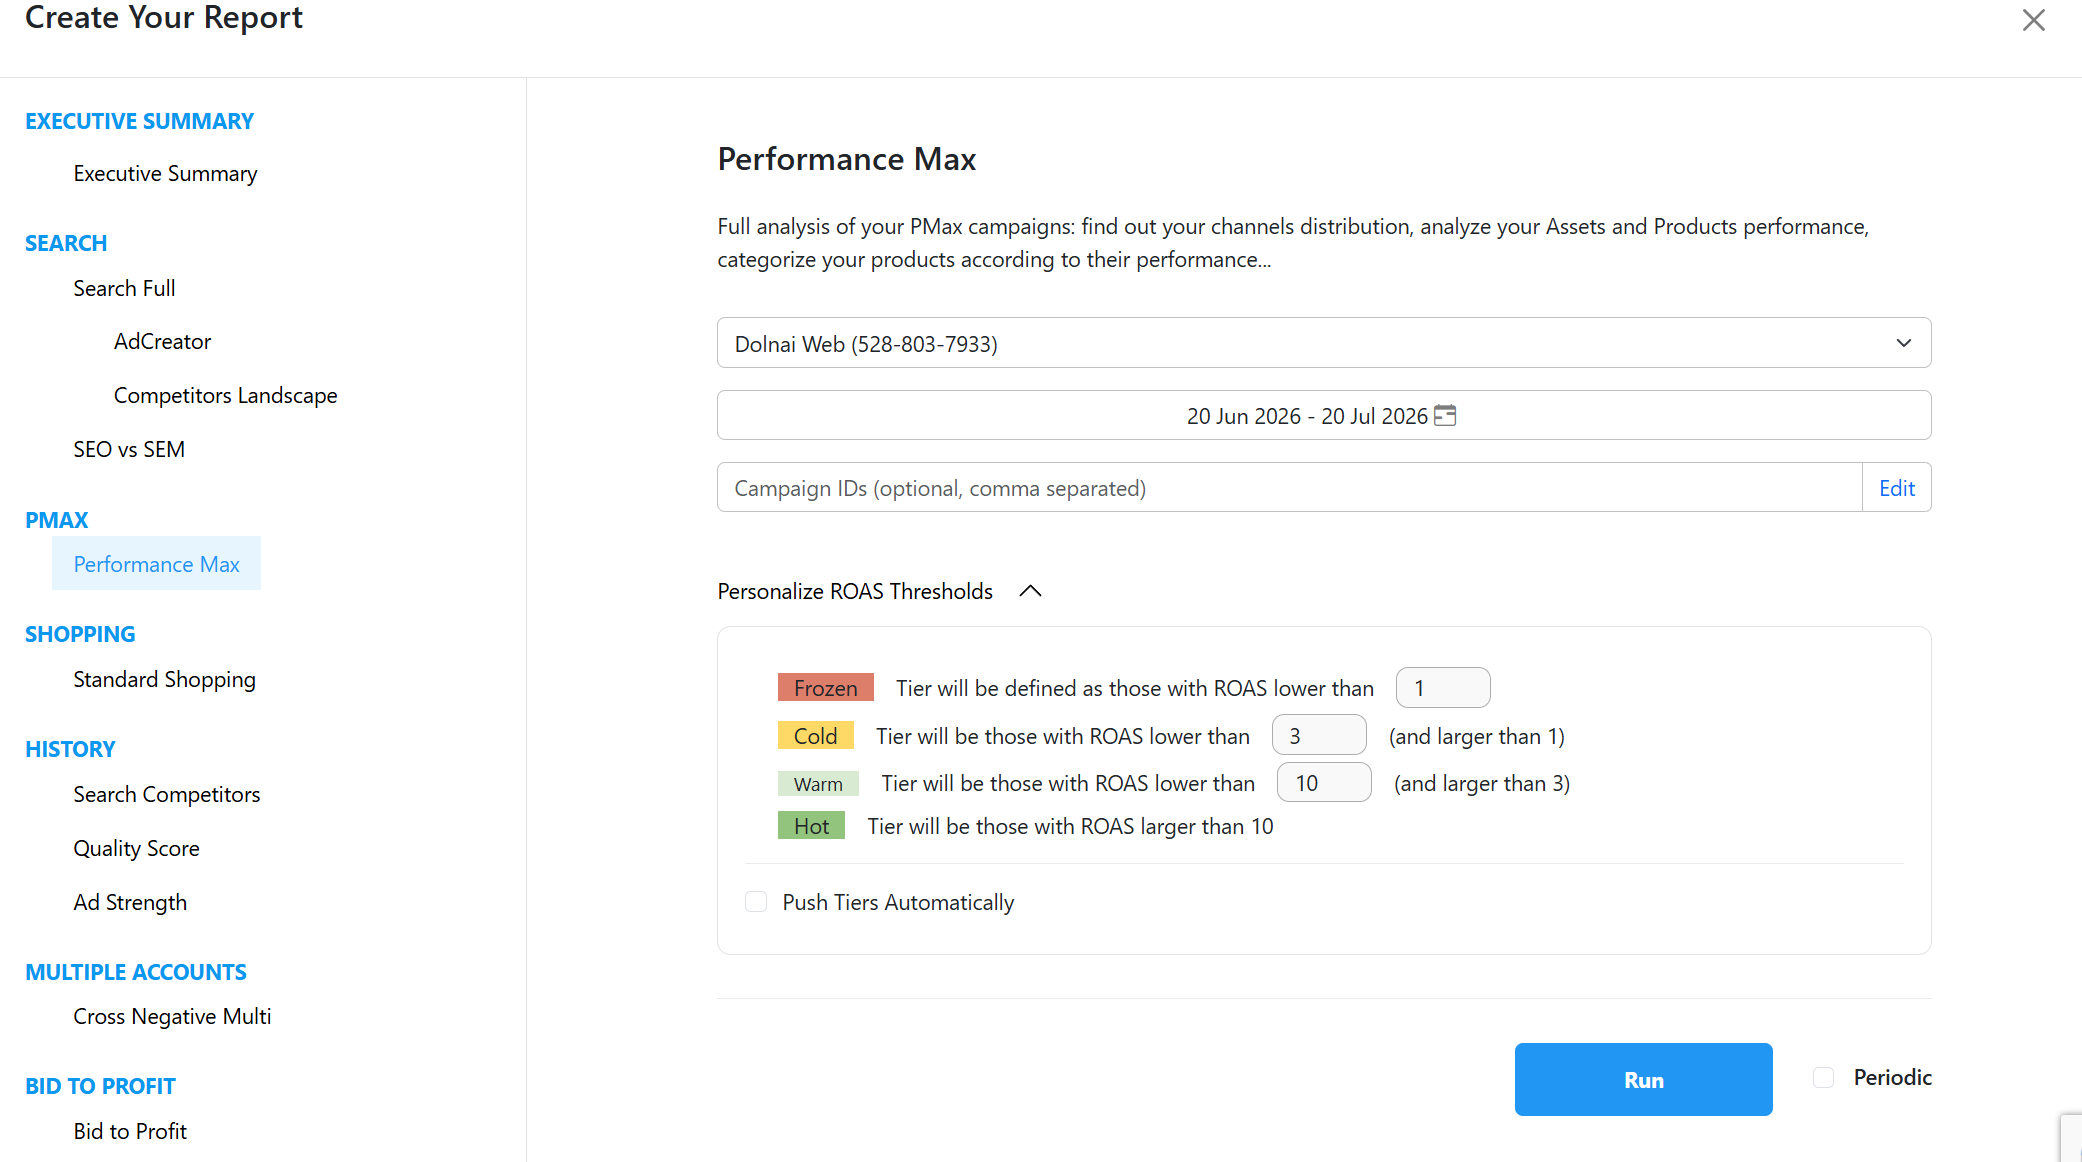
After adding you account to your profile in Dolnai, you need to create a Pmax report. It is very simple: just log in Dolnai and click New Report > Performance Max > Select Account > Select Date Range > Run.
The report will finish in a few minutes; depending on the account size and the selected date range, it may take a few hours. To view the results, click the cross icon in the upper right corner.
You can download it as an Excel spreadsheet or view the online version by clicking Pmax.
The first thing you will see in Dolnai is a distribution analysis across the different channels of this campaign. As you know, in Performance Max, it is not possible to manually choose which channels you want to appear on or in what proportion.
Channel Distribution in Pmax
Analyzing performance by channel is extremely useful to identify where you are strongest and what type of assets you should improve (videos, images, etc.). In the Channels section, you will find more details regarding the daily evolution of different KPIs per channel (expanded information is available in the downloadable version).

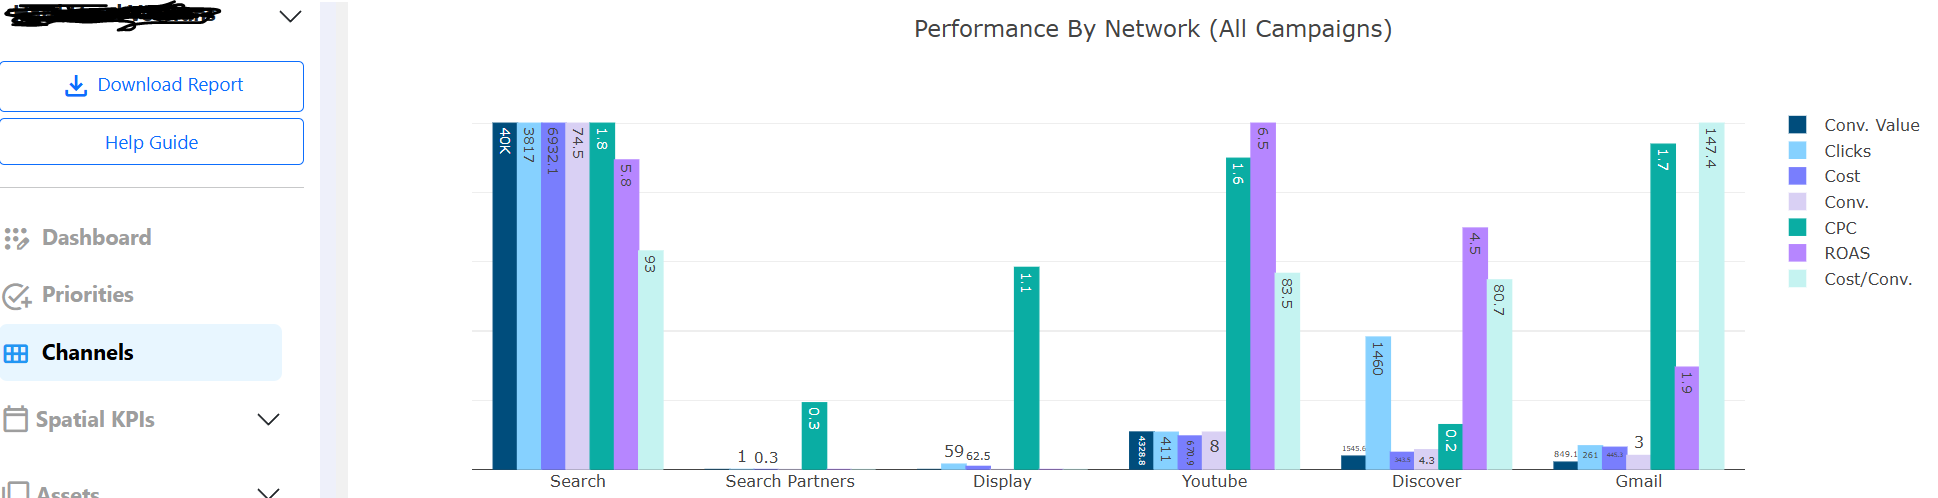
Note: This initial analysis does not distinguish between ads with product feeds (Shopping) and those without. If you are an e-commerce business interested in seeing this distribution, head over to the Products section to view that same channel distribution specifically for items with product feeds.
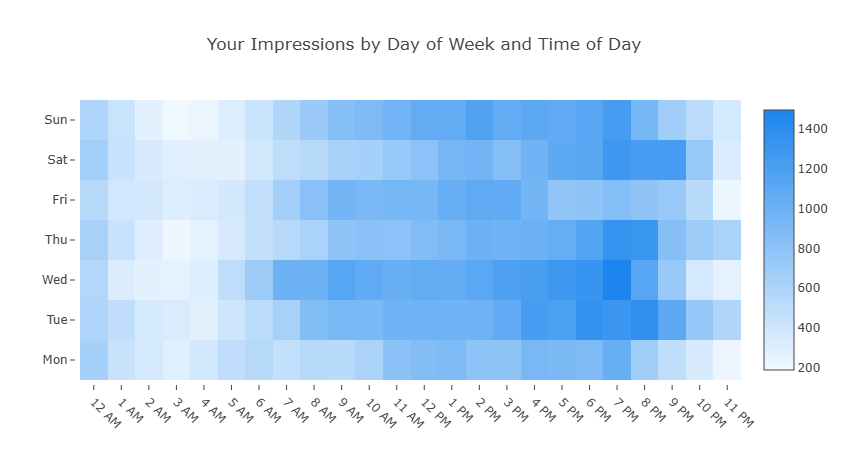
You can analyze performance by day and hour. The goal is to show your ads only during the hours that yield results, maximizing your budget efficiency. Here is a full post where we explain this strategy.
Analyze the Dashboard over an extended timeframe (such as 365 days) to determine the optimal days and times for your ads, driven by actual CPA and ROAS performance.
.png)
We also encourage you to review the GEO Map section:
Classification of assets based on their performance:
*More information on Google Ads automated assets.
In this section, you will see the channel distribution for your product feed ads. You will also find a summary table showing the overall performance of your products grouped into categories (remember you can adjust these thresholds when launching the report):

It is very common for Pareto's Principle to apply—especially in Pmax. When there are many products, Google tends to focus on showing those that have performed best, concentrating conversions into just a few items.
In this case, we see that 12% of the cost from product feed ads generated 68% of the conversion value, while 34% of the cost yielded no conversion value at all.
There are several strategies to resolve this situation and improve overall budget performance. To do so, the first step is to upload product custom labels to Merchant Center from the Products by ROAS section following these instructions.
We encourage you to read this article if you want to learn more about the strategies you can use to categorize products based on performance.
In the following subsections, you can view product performance organized by these categories:
*Products with zero impressions will not appear in the report.
Remember to confirm your changes in the Actions section.
Discover which websites, YouTube videos, mobile apps, etc., your ads are appearing on. You can select the ones where you no longer wish to show up and exclude them directly from Dolnai.
Remember: Confirm your changes in the Actions section; we provide a step-by-step walkthrough in the video.
Get expanded insights on search terms categorized by main topics and subcategories so you can add unwanted terms as negative keywords. You can also leverage these categories to broaden the search themes for your asset groups or even build new asset groups if you notice high interest in a specific subcategory of your business.
Remember: Confirm your changes in the Actions section; we provide a step-by-step walkthrough in the video.
To view this section, you must grant access to dolnai@dolnai.com in your account. You will be able to see expanded competitor insights per campaign, distinguishing between Search Network ads and product feed ads.
If you have granted access but see no data, it is likely because your account hasn't reached the 10% Impression Share required by Google to provide this data.
If you have any questions, feel free to contact your Account Manager. If you aren't a Dolnai client yet, start your free trial today!

.svg)