This is a Power Pack to Optimize PMax Campaigns
If you're using Google Ads, you've probably encountered the "black box" of Performance Max (PMax) campaigns.
I know how frustrating it is not to be able to see where your budget goes or which assets or products are generating results.
Dolnai aims to open that black box. In this manual, we will show you the process we ourselves use to audit and optimize PMax campaigns. Everything you find here is field-tested: the same steps we use with our clients and in our own campaigns.
Aimed at: SEM and PPC Managers, Media Buyers, Paid Media Managers, CMOs, and agency owners who manage Google Ads.
Performance Max campaigns are powerful, but also frustrating because Google hides critical data:
Why does Google hide this data?
Because it wants advertisers to depend on automation. The less information you see, the harder it is to question wasted spending. If you audit the hidden layers (products, locations, terms), you regain control.
You must avoid using PMAX simply because it requires less work. The criteria should be account profitability, the continuous search for efficiency, and scalability.
Being lazy can be very expensive in this case.
Before scaling, make sure your setup is solid:
Dolnai Tip: Write down what you changed and how the campaign evolved afterward. You'll save hours in the long run.
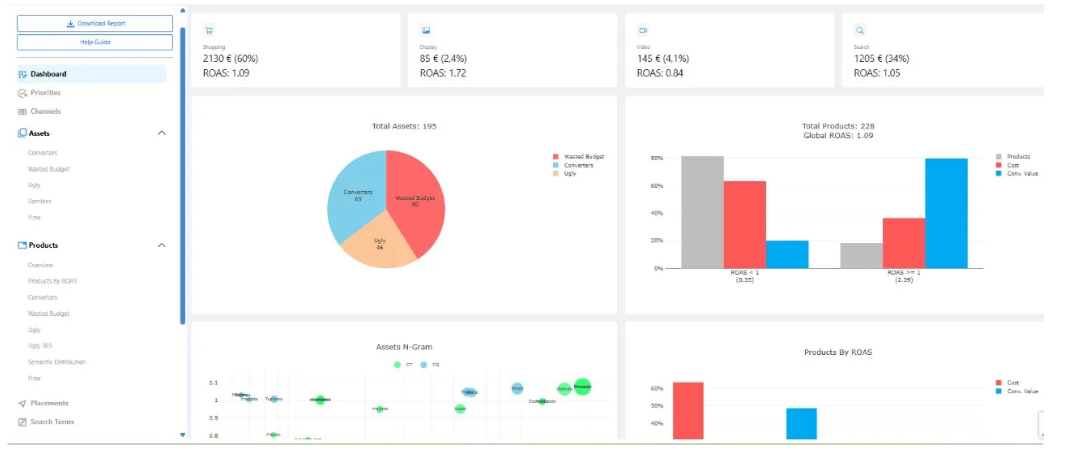
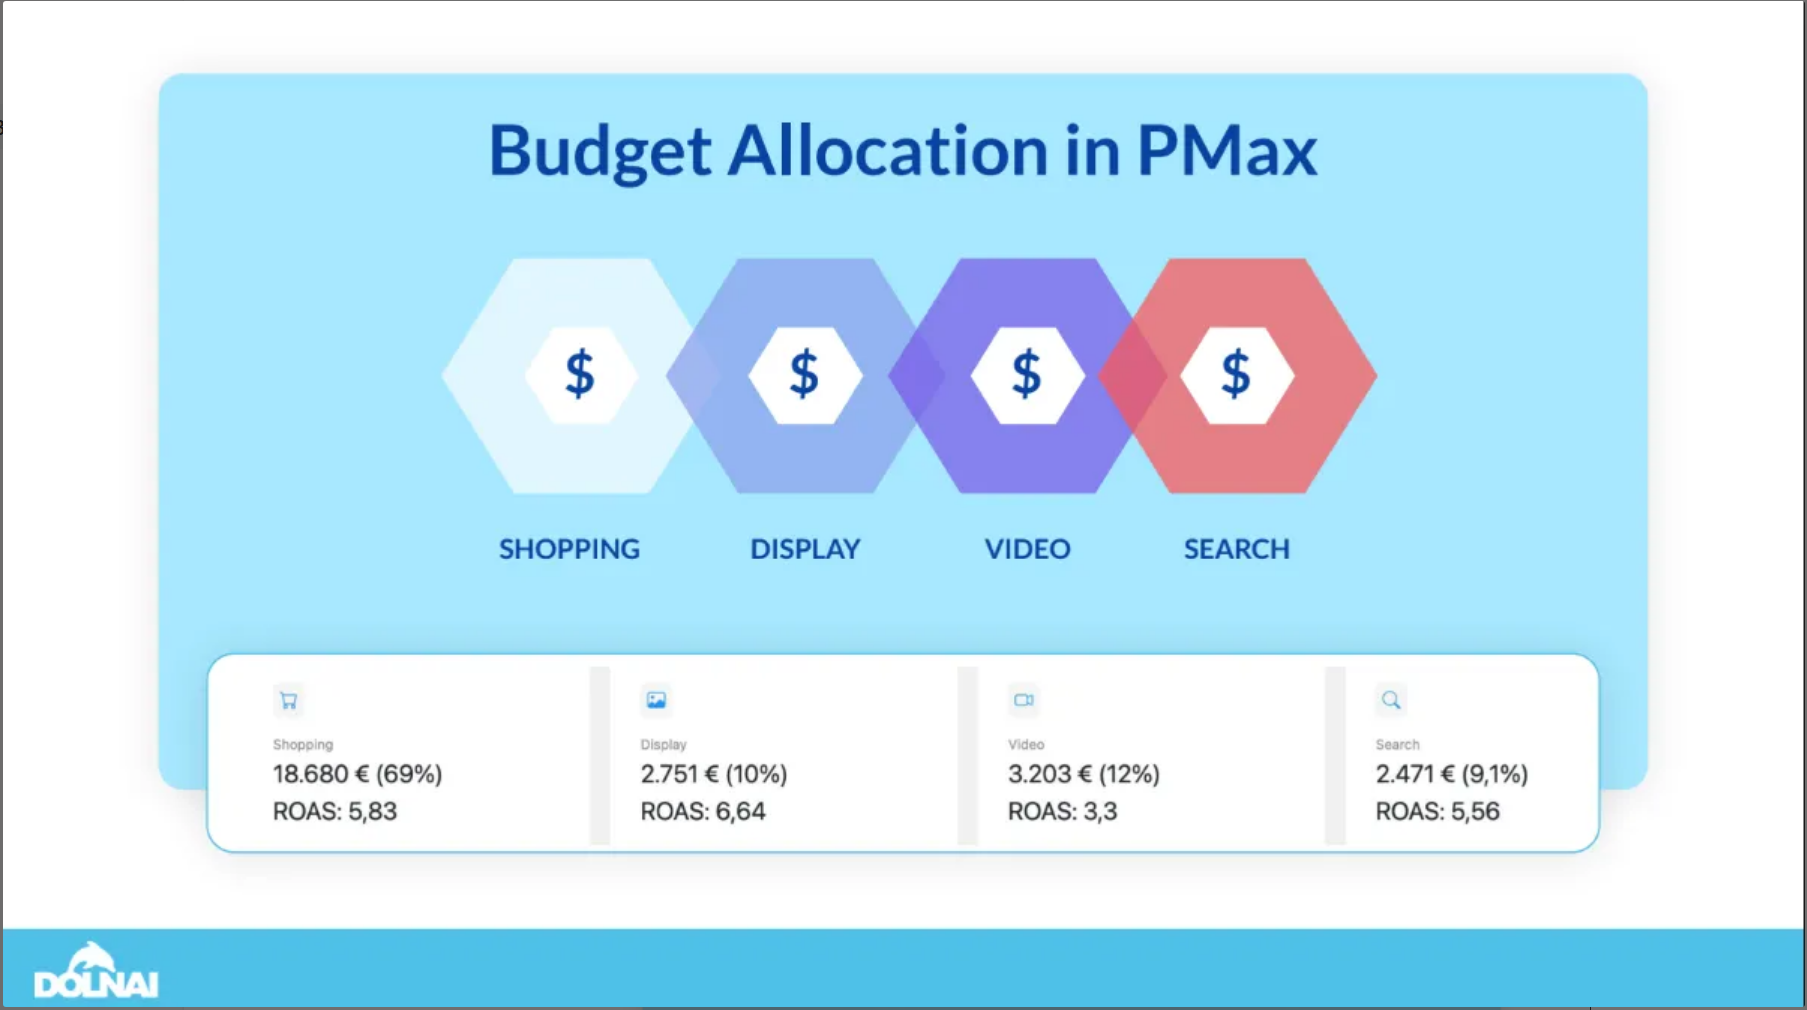
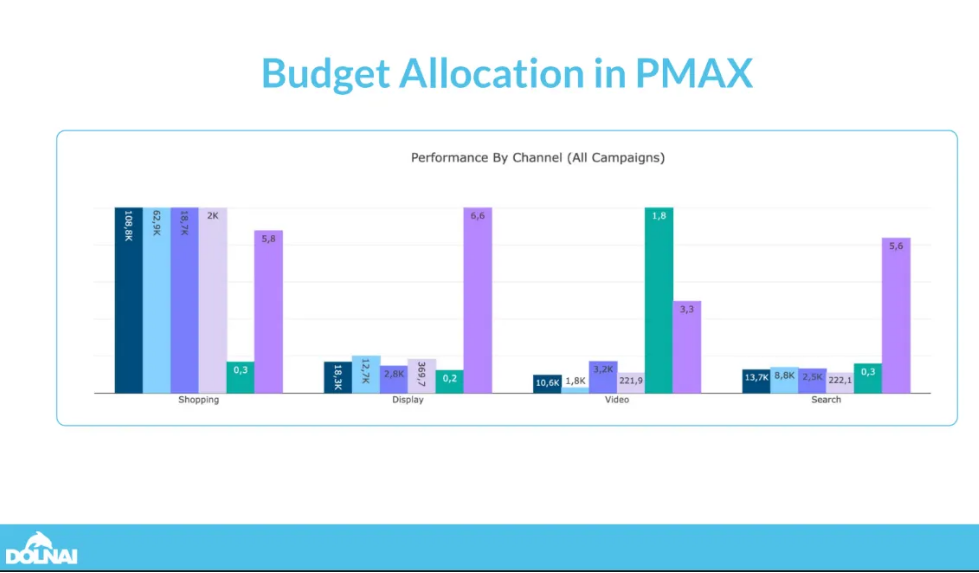
Finally, you will be able to see which channels your budget is being spent on (Search, Shopping, YouTube, Display, etc.).
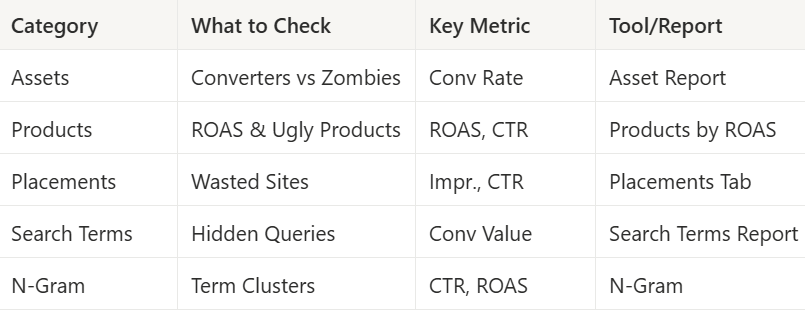
What to review:
Actions:
Many advertisers don't realize: Shopping can receive only 50%–60% of PMax spending, while Display and Video will silently "burn" budget. Dolnai offers the distribution of PMax spending by channel and the results of the main KPIs.

Identify channels that consume >20% of the budget but generate ROAS <1 return, redistribute 10-20% to Shopping/Search, and monitor daily.

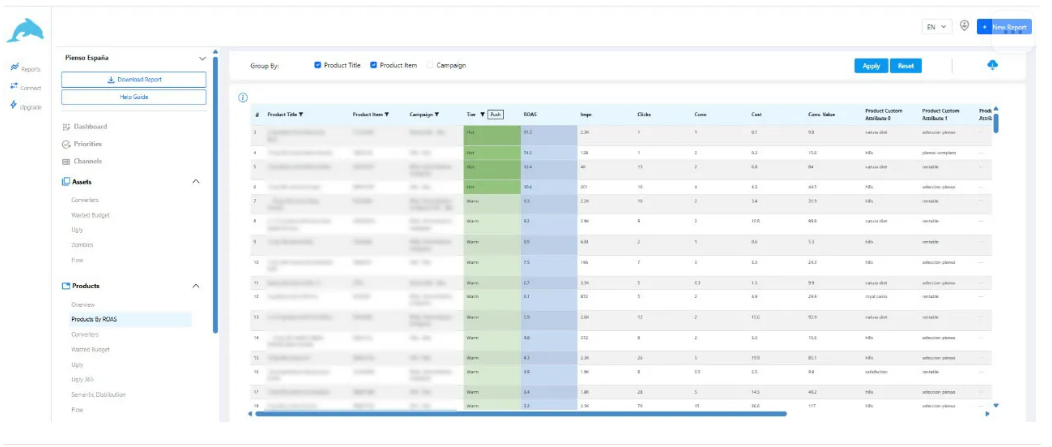
Define bidding strategies based on ROAS at the SKU level. Group them to categorize them and maximize impression share for the best ones.
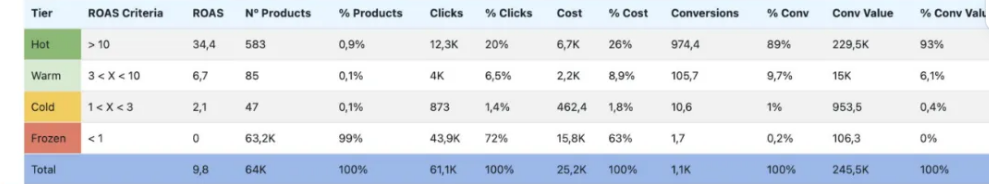
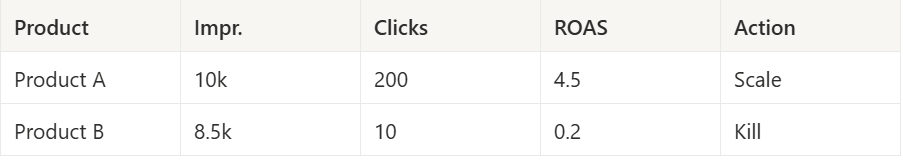
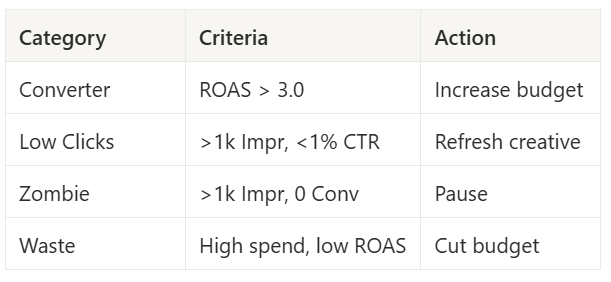
Prioritize products based on their performance:
Practical suggestion: separate your best-selling products into their own PMax campaign so that the algorithm gives them more space.
⚡ Case study: Apply differentiated bidding strategies according to the particular performance of each product (SKU).
We modified the bid of 5,000 SKUs → we focused on the top 250. ROAS increased by +180% overnight.
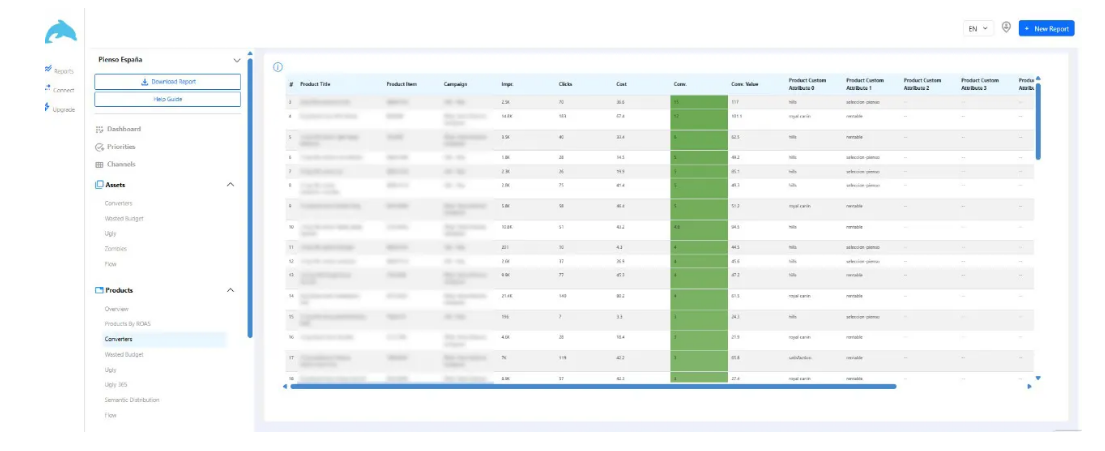
High ROAS winners, break-even, and poor sellers.
Helps to maximize impression share on winners while reducing spending on dead stock.
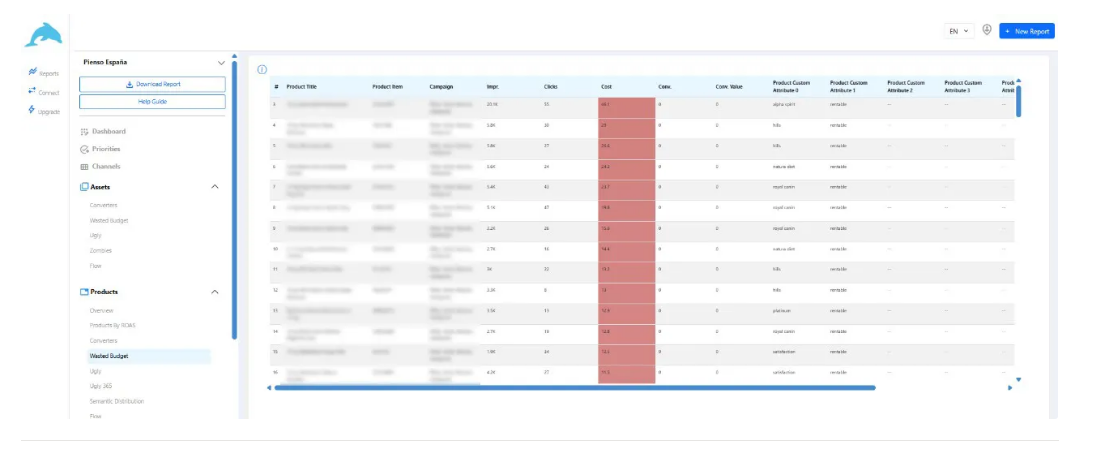
📊 Example:
The top 10% of products can generate 60–70% of revenue.
Poor sellers can drain more than 25% of the advertising budget without it being noticed.
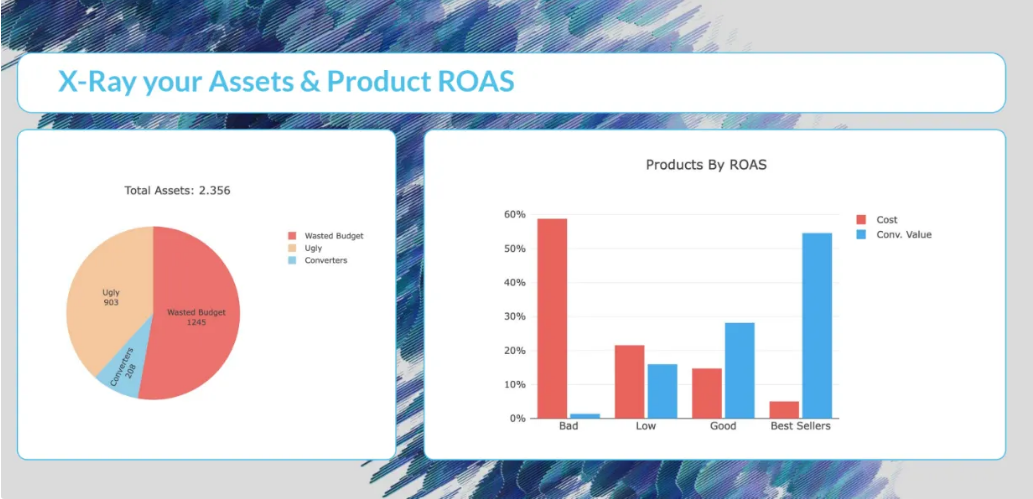
Products that remain "ugly" for more than 365 days should be removed or repositioned. Restructure them with new titles/images → tested with Dolnai “X-Ray.”
These are products that have had impressions but no one has clicked on them. No one has wanted to touch them even with a stick.
They don't have to be bad, but their description or the way you're trying to sell them isn't working. Change things.
When to pause vs. restructure
🛑 Pause → 0 conversions for more than 3 months.
🔁 Restructure → Some clicks but low CTR. Try new titles or groupings.
Your PMax ads appear on varied and incorrect apps/sites; many may be wasting budget:
What to do next:
🚫 Exclude irrelevant mobile gaming apps (common source of wasted spending). Also exclude children's YouTube videos.
🎯 Leverage competitor sites with high purchase intent.
📍 Placements show where your ads are published — many are irrelevant websites that drain your budget.

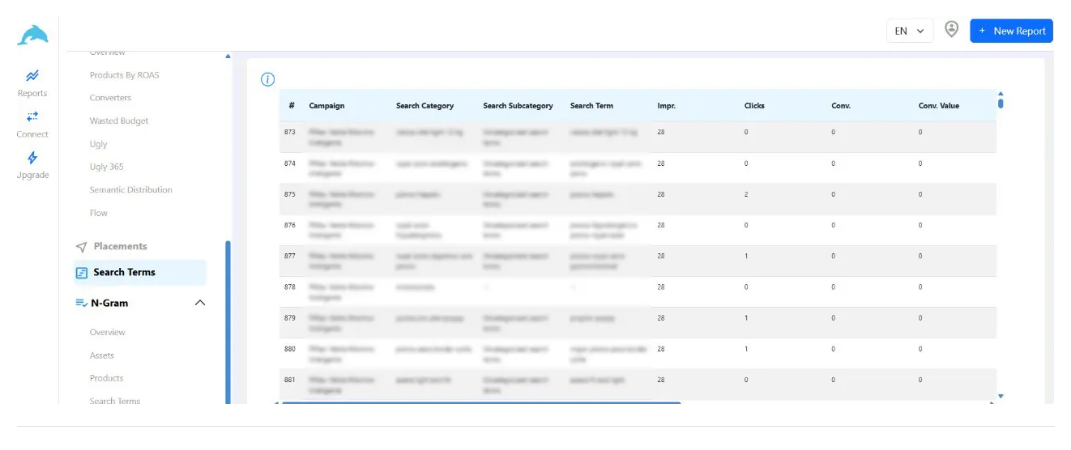
Keep some search term control:
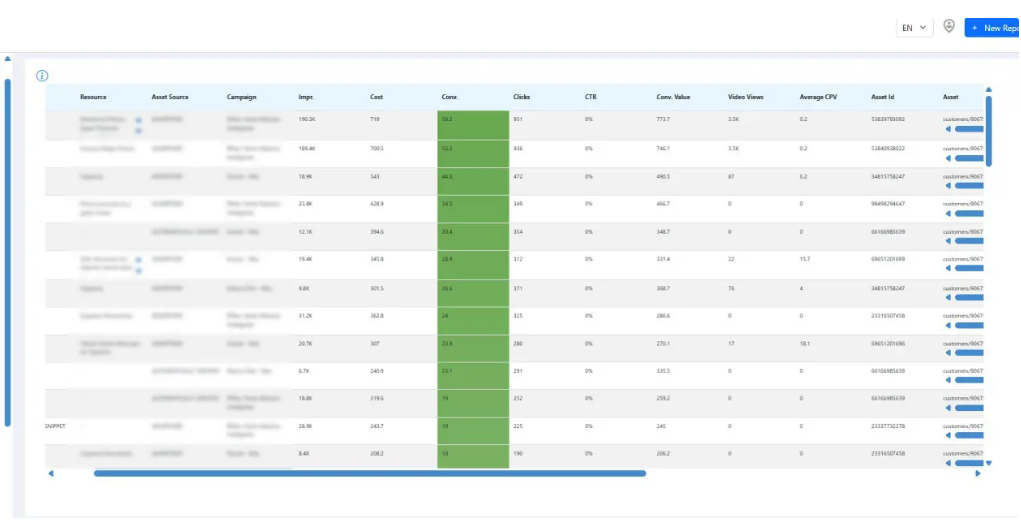
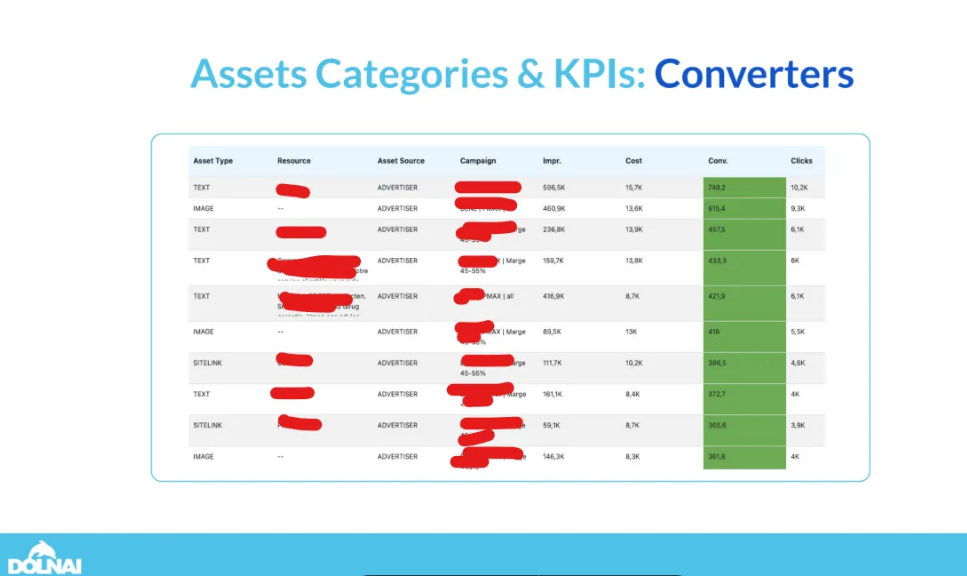
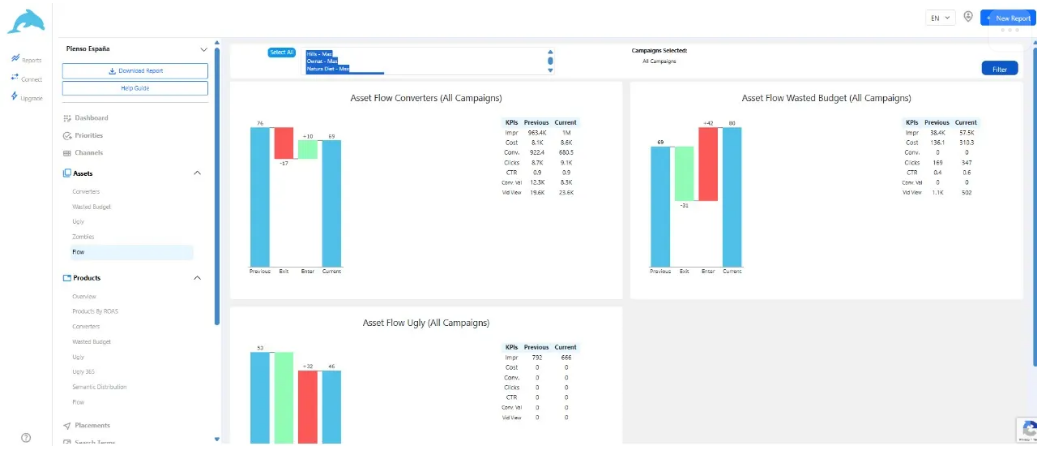
Assets are your most powerful lever in PMax. They are the creative elements that make up your ads. Google usually doesn't ask for them, and can generate them directly. Analyze them and act.
Classifying them:
Measure CTR, CPA, Conversions. Replace weaker assets with winners.
Identify assets that sell vs assets that flop.
PMax is not something you set up and forget:
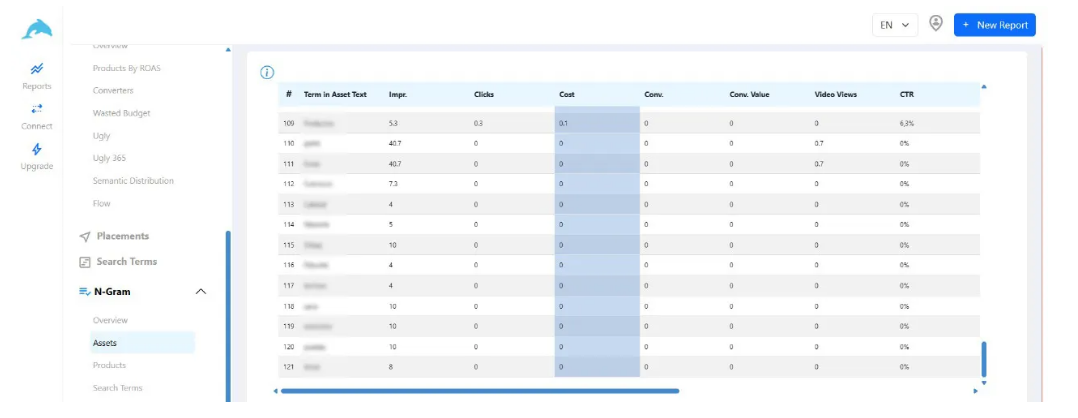
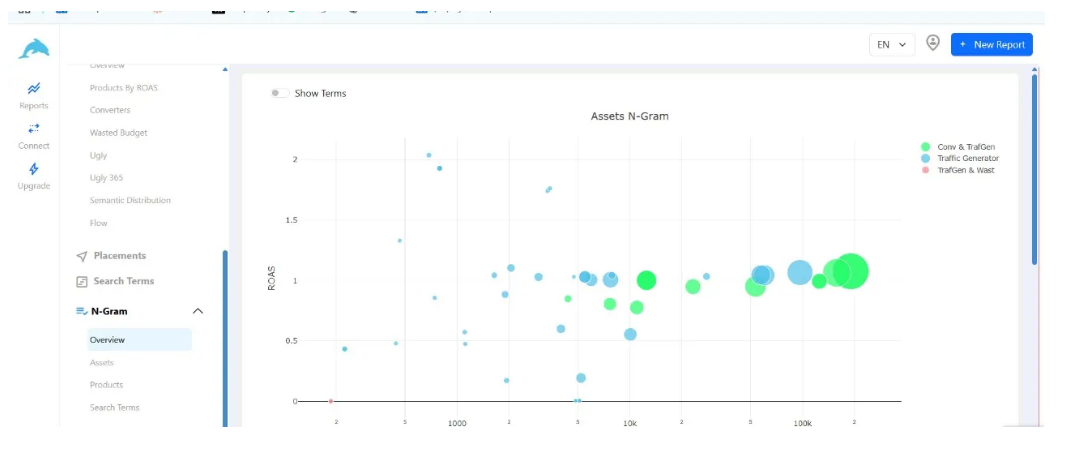
Use additional Dolnai tools: channel breakdown, grouping by ROAS, N-Gram analysis, placement visibility.
The N-Gram helps you not only with negatives, but also with creative patterns. It allows you to fine-tune much more and reach the maximum level of detail, to understand if it is better to say: "Buy now" or "Get it now". You will know if "gafas" or "lentes" works better for you.

Dolnai Tip: If campaigns have similar intent → merge. If audiences differ → segment for greater precision.
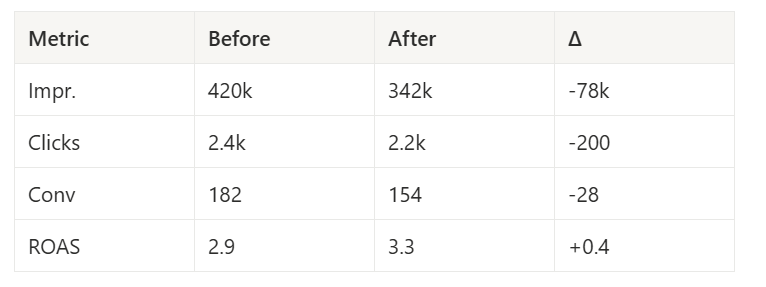
A fashion advertiser investing €200,000/month reduced wasted Display spending by 27%, redistributed those resources to Shopping/Search, and improved their ROAS by 22% in 60 days.
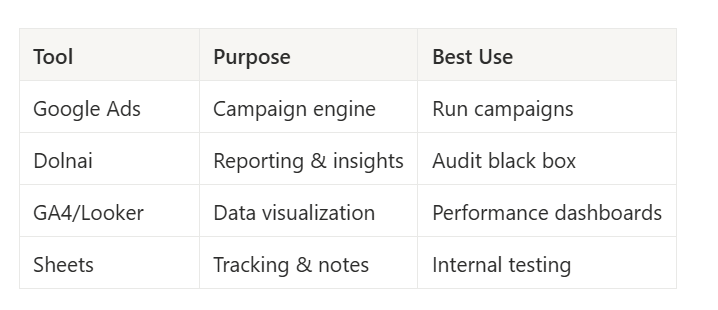
Use complementary tools that increase your visibility and capacity for action on PMax campaigns.
PMax is a tool to achieve business objectives (sales, ROAS, customer acquisition). When applying these corrections, ask yourself: "Did I get closer to my goal?"
Sometimes, eliminating waste reduces conversions but improves profitability: make sure to align your actions with your goal (maximize conversions or efficiency?).
Finally, human creativity matters: PMax is Google's AI automating, but you provide strategy, creative adjustments, and business vision.
Stop wasting spend, save your team hours every week, and unlock profitable growth.
.svg)